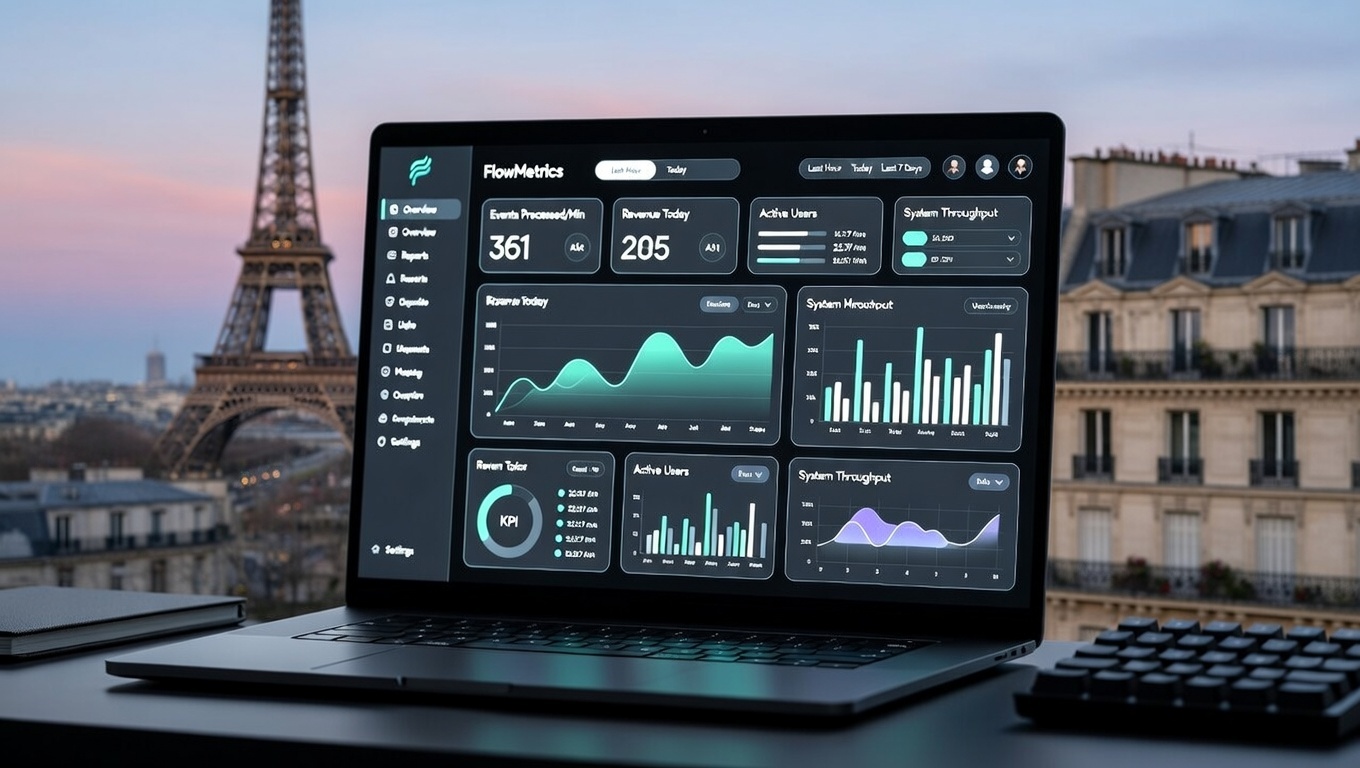
FlowMetrics BI Dashboard
Real-time analytics platform processing 50M+ events per day, replacing a reporting stack that was 36 hours behind and costing the team 3 days per week in manual exports.
The Challenge
Manual reporting across 6 disconnected data sources. The data team was spending 3 days every week pulling CSVs, joining them in Excel, and formatting reports for leadership — all on data that was already 36+ hours stale by the time it arrived.
Our Approach
We mapped every data source, designed a star-schema warehouse in BigQuery, and built ELT pipelines in dbt that ingest and transform data on a 15-minute schedule. On top of that, we built a custom React dashboard (replacing Looker for their core use case) with live WebSocket updates, drill-down filtering, and export tooling — all served from a FastAPI backend with Redis caching.
The Outcome
Reports now refresh every 15 minutes. The data team's manual reporting burden dropped to zero. Leadership has a live dashboard they can interrogate without filing a request.


“We went from spending 3 days a week on manual reports to having live data in front of leadership at all times. The VeilCode team understood our data model faster than any vendor we've worked with.”
PNPriya Nair
Head of Data, FlowMetrics
Let's Build Something Extraordinary Together
Whether you need a full product build, an analytics overhaul, or intelligent automation — we're ready to move fast.